Data Analysis
Turn scattered records into decisions you can act on
Dashboards, reporting, and data analytics that turn scattered business records into decisions you can act on.
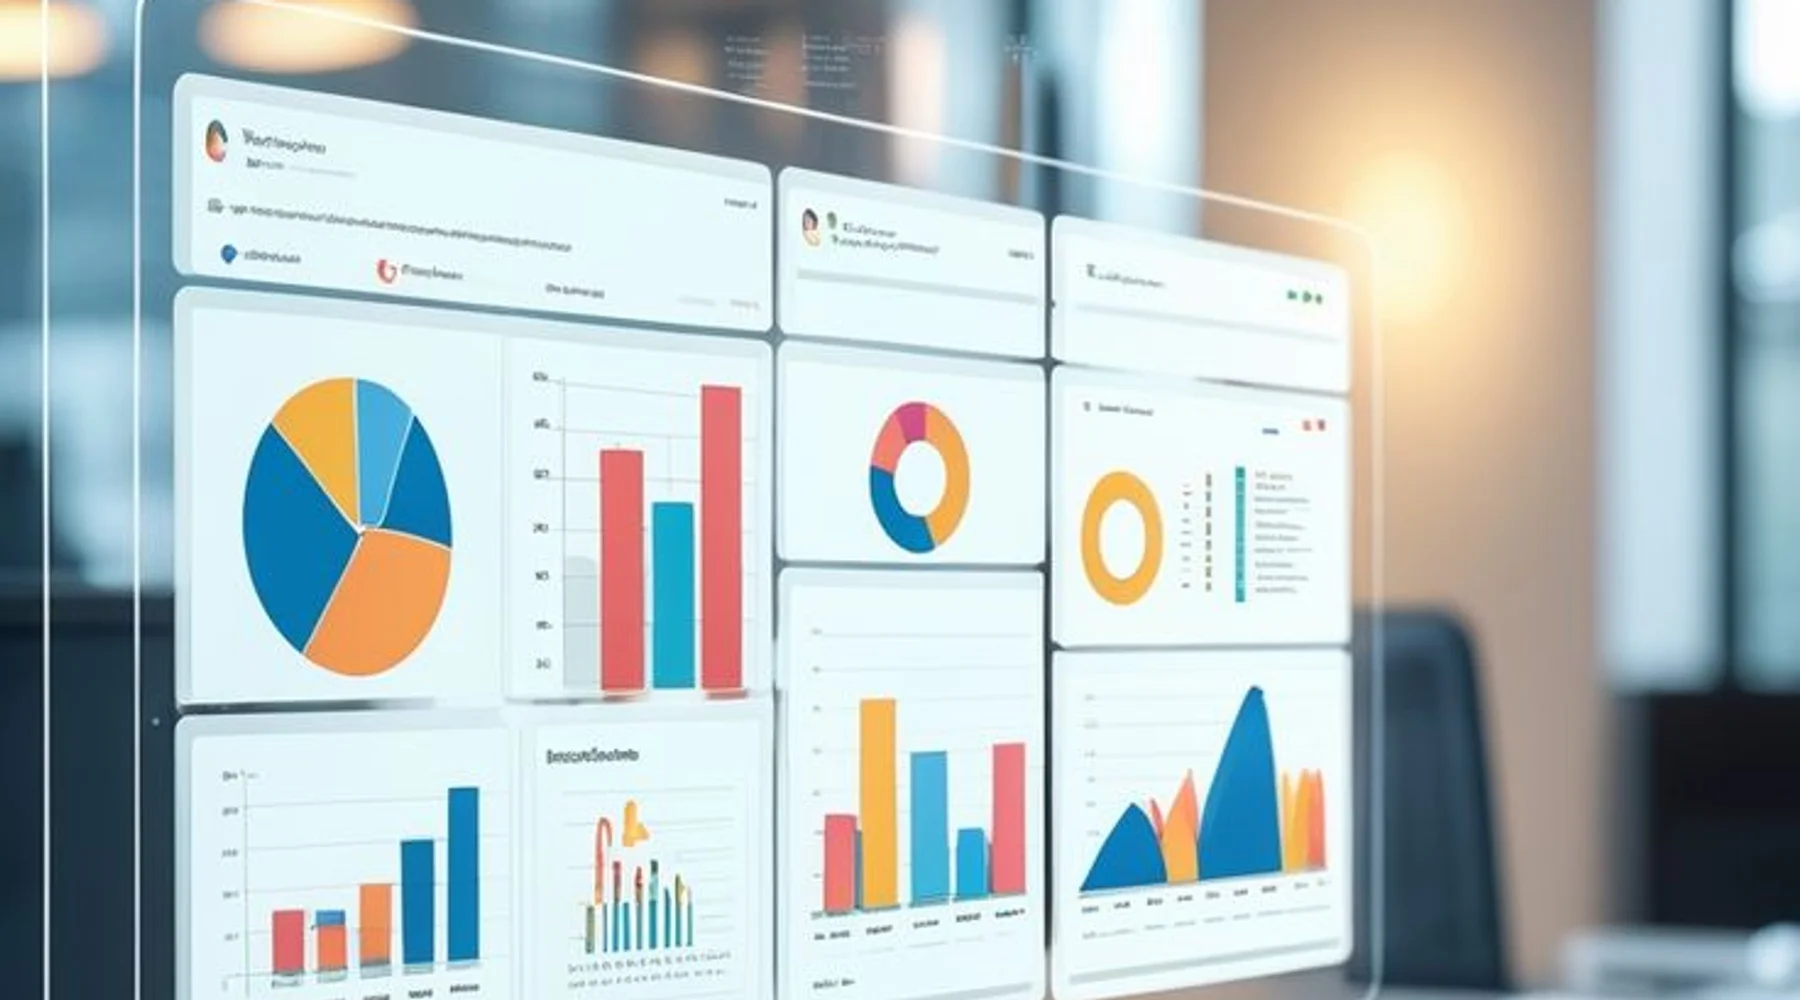
Most organizations already have the data they need, it is just spread across spreadsheets, systems, and paper that nobody has time to reconcile. We build dashboards and reports that pull it together into a view leadership can actually use.
This covers new reporting builds as well as making sense of an existing system's data that has become messy, inconsistent, or hard to trust.
What you get
- +Reporting dashboards
- +Data visualization
- +Business intelligence setup
Results you should expect
- Dashboards that answer real business questions at a glance
- Reports that reconcile instead of contradicting each other
- Trends and patterns surfaced before they become problems
- Less time spent assembling numbers by hand every month
A delivery process you can follow from start to launch
- Step 1
Discovery
We start by understanding your business, your team, and the workflow you already rely on before proposing anything technical.
- Step 2
Design
We map the structure, screens, and journeys so everyone can see the shape of the solution before development begins.
- Step 3
Build
We develop in reviewable stages, so you see working progress early instead of waiting until the very end.
- Step 4
Launch and support
We handle deployment, train your team, and stay available for adjustments once the solution meets real users.
Common questions about data analysis
Can you work with our existing data and systems?
Yes. We audit what you already have, then build reporting and dashboards on top of it rather than asking you to switch systems first.
Do you build one-off reports or ongoing dashboards?
Both. Many clients start with a one-time analysis, then move to a live dashboard once they see which numbers matter most.
Other services
Web Development
We design and build websites that present your business clearly, convert visitors into inquiries, and feel strong across mobile and desktop.
Read moreMobile App Development
From staff tools to customer apps, we create mobile experiences that are practical, reliable, and easy to scale.
Read moreUI/UX Design
We turn complex workflows into interfaces people can understand quickly, reducing friction and increasing confidence.
Read more